
If you watch his most recent ad, President Obama is using the same old lie: http://www.huffingtonpost.com/2012/10/12/obama-mitt-romney-tax-rate_n_1962187.html (the video is near the bottom).
Why is this deception? Well, I've written about that before... many times: http://loudmouthelephant.blogspot.com/2012/08/obama-continues-to-lie-about-taxes.html
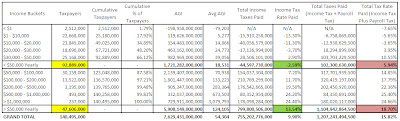
President Obama is trying to convince Americans that Mitt Romney paid a lower tax rate than they did. This is profoundly incorrect, and the most important evidence to back my point, (taken from my previous post linked above) is the following table found in this IRS document which contains pertinent tax rate data:

Why is this deception? Well, I've written about that before... many times: http://loudmouthelephant.blogspot.com/2012/08/obama-continues-to-lie-about-taxes.html
President Obama is trying to convince Americans that Mitt Romney paid a lower tax rate than they did. This is profoundly incorrect, and the most important evidence to back my point, (taken from my previous post linked above) is the following table found in this IRS document which contains pertinent tax rate data:

Click Image for Expanded View
These data show the number of income tax returns filed in their respective income ranges (the number is in thousands). For example, in 2009, there were 18,696,000 tax returns filed where the filer earned between $20,000 and $30,000. In the image, you will notice some data is circled. The large red oval encompases incomes that are < $50,000 yearly. The green oval encompasses incomes that are > $50,000 yearly. I've expanded upon this in the chart below.
Click Image for Expanded View
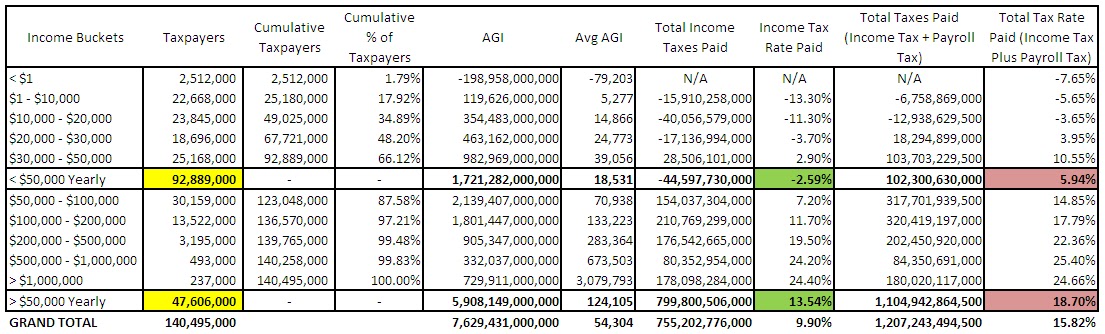
You will notice some key pieces of data highlighted on this chart. The chart also distributes the two taxpayer buckets circled in red and green the IRS chart: those making < $50,000 per year, and those making > $50,000 per year. The explanations are as follows:
- Yellow highlight: This is showing the breakdown of incomes for the overall taxpayer buckets. Those making < $50,000 comprise 92,889,000 of the 140,495,000 total tax filers, which is around 66% of the total. Many people focus on the "50% mark" - the income at which 50% of Americans make more and 50% of Americans make less. This is around $40,000 per year.
- Green highlight: This highlight shows the final income tax rate paid by each group. As you can see, those making < $50,000 paid an average income tax rate of -2.59%, and those making above $50,000 paid an average income tax rate of 13.54%. Each income bucket shows the respective rate paid by those within the bucket. For example, those making between $30,000 and $50,000 paid an income tax rate of about 2.9% while those making $200,000 to $500,000 paid an income tax rate of about 19.5%.
- Red highlight: This highlight shows the final tax rate paid after payroll taxes (Social Security, Medicare/Medicaid, etc.) are factored in. You will notice that since these taxes are paid on the first $106,000 income, they affect those in the < $50,000 bucket more. For those in the upper income ranges, there is little change from their pre-payroll tax rate and after these taxes are applied. Regardless, when these taxes are factored in, those making < $50,000 (again, about 66% of the all Americans), paid a total tax rate of about 5.4%. You will notice that those making > $50,000 paid a total tax rate of about 18.7%. The true "middle income group," those making between $30,000 - $50,000 yearly (the average American income falls in this range), paid a total tax rate of about 10.55%
All the data presented in this analysis is FINAL. All tax rates are final. This means that every rate is presented after loopholes, deductions, and write-offs.
Why is this all significant? Well, for starters, as stated, President Obama tries to claim that Mitt Romney pays a lower tax rate than "you." I have stated time and time again that this is simply deceiving. Mitt Romney paid around 14% of his income in taxes; 66% of Americans paid 5.94%. How can he be paying a lower tax rate than most Americans when most Americans pay a grand total of about 5.94% in federal taxes? Fact: he doesn't. Mitt Romney paid a higher greater tax rate than most Americans. Period.
Additionally, I know there are many taxpayers out there that claim, "I make $40,000 and I paid a higher rate than Mitt Romney," but, when looking at the whole picture, my answer to those people falls into one of two categories:
1. No you didn't. Yes, while you have paid your taxes throughout the year, you had these taxes removed from your paycheck. And yes, it seemed like they were removing quite a bit (from my paycheck, around 27% is removed each time). What most people seem to forget is that lower income earners tend to receive large tax refunds (notice the large negative income tax rates for low-income earners above). These people often forget to factor refunds in, and these refunds reduce the FINAL RATE PAID significantly. Take a look at my tax return info and see how much I received in a refund. That refund reduced my tax rate quite a bit: http://loudmouthelephant.blogspot.com/2012/01/part-2-what-do-mitt-romneys-tax-returns.html
2.You're a statistic anomaly. It's that simple. IRS data, as seen above, shows that those making < $50,000 annually, the majority of Americans, do NOT pay a greater rate than 14%. If you are, for whatever reason you do, you're a rare breed.
In summary, can someone please explain to me how Barack Obama's claim of Mitt Romney paying greater tax rates than most Americans is true? The case does exist, but on such an insignificant level. The facts and data show that Obama's claim is just plain false. This has been shown time and time again, but yet Team Obama keeps repeating the same lie. How can anyone be okay with this? Please share your thoughts below.
In summary, can someone please explain to me how Barack Obama's claim of Mitt Romney paying greater tax rates than most Americans is true? The case does exist, but on such an insignificant level. The facts and data show that Obama's claim is just plain false. This has been shown time and time again, but yet Team Obama keeps repeating the same lie. How can anyone be okay with this? Please share your thoughts below.
http://www.factcheck.org/2012/08/does-romney-pay-a-lower-rate-in-taxes-than-you/
ReplyDeleteLME, according to the factcheck.org article linked to above, if you factor in payroll taxes AND the portion that your EMPLOYER pays it is "probably true".
ReplyDeleteIsn't that laughable? If you take your tax rate and the tax rate that your employer pays (though it doesn't cost you)the ad is close to being right.
It seems like to me the "nonpartisan organization" is bending over backwards to keep from calling the ad "pants on fire".
Slim - In all honesty, the article linked above is very disingenuous. In fact, I don't really trust it at all. I'm not sure if the author read it; it seems that they simply did a "Mitt Romney pays a lower tax rate than you" Google search. I could not stand by that article. Here's why:
ReplyDelete1. It cites NO data. None. It cites this: "In February, the nonpartisan Tax Policy Center released an analysis that found that when you include income tax and payroll taxes paid both by the employee and employer, people in the middle 20 percent paid an effective rate of 15.5 percent."
Which is what my data shows, too. In fact, you could break down every income in the US into 5 quintiles (20% groups). If you look at the data I present, it sort of breaks down this way. The 30k - 50k and the 50k - 100k is the "middle 20%" just as the "fact checker" article said. This is, again, disingenuous. Look at the population samples for all groups. $30k and less has about 68 million members, or about 48%. Right there, nearly HALF of the population pays a total tax rate of 3.95%. The article does not mention this. If you include people making $30k - 50 k ( keep in mind, this is a $20k income range instead of a $10k one) - that's 93 million out of 140.5 million, or about 66% of the population. So if 66% of the population, WITH payroll taxes included, pays an average rate of 5.94% (even those from $30k - $50k pay 10.55%), how can Mitt "probably" pay a lower tax rate than Americans. This is simply not true.
In a sense, the person who posted that article believes fact checkers who do not provide data, while calling cited, linked, and shown, IRS data that shows the truth?
Slim - this fact checker says otherwise. The top one is wrong: http://www.politifact.com/truth-o-meter/statements/2011/jul/12/timothy-geithner/geithner-says-top-1-percent-have-tax-rate-low-20s/
ReplyDeleteThe CBO chart covers only the federal individual income tax, which is the one Geithner was discussing. But even if you fold in other federal taxes (corporate, estate, Social Security and Medicare), average rates remain higher for the richest group than for everyone else. The non-partisan Urban-Brookings center folded in the other forms of federal taxes for 2011, and found that the top 1 percent will pay 27.6 percent, and that rates steadily decline for the less-wealthy until they reach zero (a little less, actually) for the lowest one-fifth of earners.
LME & MN4Rick (Hi MN4Rick), I think the factcheck.org article that Anonymous linked to is bovine excrement too.
ReplyDeleteTo make their point, you have to COMBINE the taxes you pay along with the taxes your employer pays to still come up short of the 0bama campaign ad claims.
It is amusing to me that they would even attempt to use that method. I think the "nonpartisan" group is in fact, very partisan.
Sorry, if I wasn't clear enough. I agree with LME's analysis. I was just citing what the "nonpartisan fact checkers" assertion was.
I am self employed, however if I weren't, I would base my tax rate on what I pay. My employer's tax liability wouldn't factor into my calculation of what my tax rate is, because I would not be paying it (employer's tax liability).
Also LME, your IRS data is from 2009. The 0bama ad is talking about Romney's 2011 tax return. In 2011, employees only paid 5.65% for SSEC and Medicare, not the normal 7.65% rate. So to accurately compare the 2009 data to Romney's return you would need to deduct two percentage points from the pink shaded column that shows the tax rate with payroll taxes. I am not questioning your analysis and I realize that is probably the most current data that you have access to. However, I do payroll for my employees and I know what the rates are. I also realize that people that don't do payroll every week (and the corresponding tax deposits and quarterly reports) may forget about the reduced Social Security rate for employees for 2011 and 2012. The employer still pays 7.65% though.
So if all the numbers for Federal income tax were the same in 2011 as it was for 2009, the pink column for <$50,000 per year would be 3.94% (not the 5.94% like it was in 2009 and 2010). This would make Romney's rate about 4 times higher than the vast majority of the tax paying public.
Sorry for the confusion guys. Have a great day.
should we not be using TOTAL income versus AGI for this to make sense?
ReplyDeleteBig Hat - Thank you for the response. For me, there are 3 ways to answer this:
Delete1. AGI helps us get at a "final" income from which the "final" tax rate is calculated. Additionally, when looking at individual tax rates (say, Barack Obama's vs. Mitt Romney's), it does work better to use total income. When aggregating data across numerous income buckets, tax brackets, etc., it's more accurate to use AGI.
2. Using total income would actually make the wealthy look like they pay even more. If we used total income, we would not be using deductions to reduce incomes. Much of the wealthy's income is from capital gains. If we reduced a chunk of someone's income (via deductions) on cap gains income, we are reducing something taxed 15% versus income taxed at 15% or 25% (Income of $35,351 – $85,650). Deductions for lower income individuals have a greater effect using AGI, and because there are more lower income individuals in the country than wealthier ones, this leads to more accurate conclusions. Using total income would make the rich appear to pay even more.
3. This is the standard used by the IRS. In short, I would say it's not my call :-)
I hope I answered these questions. Thank you again, and I hope to hear back from you soon. Also, do you have an input on the argument the article itself presents?