
One of the issues with respect to the accuracy of my methods is that I aggregate state-wide polling results using national party affiliation data. This is a valid point, and to answer this, I included two nationwide samples of party affiliation to provide two views of how an individual state's party affiliation might exist. It's not perfect, but in my opinion, it certainly paints a better picture than the over sampling we see in recent polls. This post will remain posted at the top of the blog.
As stated in the original post linked above, whenever I see a poll from realclearpolitics.com, I will try to give an un-skewed version of it. If it is a national poll, I will use nationwide party affiliation samples. If it is a statewide poll, I will use both national affiliation samples plus the most recently available Gallup measure of individual party affiliation seen here: http://www.gallup.com/poll/125066/State-States.aspx. If anyone has a different sample of state party affiliation, please let me know (loudmouthelephant@gmail.com). In order to do this analysis, the poll posted at RCP must provide information showing how each party voted. The results will be stored in chronological order below, and in some cases, I will provide a brief synopsis of the un-skewed results in the title of each summary.
November 6: IBD/TIPP poll oversamples democrats by +7
Poll: http://news.investors.com/special-report/508415-ibdtipp-poll.aspx
Results:

Click Image for Expanded View
Summary: The +7 D oversampling leads to an Obama lead, but once unskewed, Romney's strength with independents, even in Gallup's democrat-leaning spread, show the former governor up by +0.3.
November 5 (Update #1 - 2:18 pm) - Monmouth University Poll and OH, IA, and NH polls:
Monmouth University Poll: http://cms.monmouth.edu/assets/0/84/159/2147483694/c8af3c69-d7c7-4f41-9749-99d4fa948484.pdf
Results:
Click Image for Expanded View
Survey USA OH: http://www.surveyusa.com/client/PollReport.aspx?g=32d7a523-b7b4-40fe-81e6-cd91eb6a23a1
Results:

Click Image for Expanded View
Summary:
Monmouth Reported: Tie - After unskew: Romney +3.0 (strong support from independents)
Survey USA OH Reported: Obama +5 - After unskew: Romney +0.3
ARG IA Reported: Romney +1 - After unskew: Obama +2.3
ARG NH Reported: Tie - After unskew: Obama +1.3
November 5 - Lots of polls today. CNN releases a crazily-skewed poll (D +11) and Pew releases a national poll as well, and lots of state polls (this list will be updated as needed today).
CNN: http://i2.cdn.turner.com/cnn/2012/images/11/04/top16.pdf
Pew: http://www.people-press.org/files/legacy-pdf/11-4-12%20Election%20Weekend%20Release.pdf
State Polls:
PPP OH/VA: http://www.publicpolicypolling.com/pdf/2011/PPP_ReleaseOHVA_1104.pdf
PPP FL/NC: http://www.publicpolicypolling.com/pdf/2011/PPP_Release_FLNC_1105.pdf
PPP IA/NH: http://www.publicpolicypolling.com/pdf/2011/PPP_Release_IANH_1104.pdf
National Polls:

Click Image for Expanded View
State Polls:

Click Image for Expanded View
Summary: I don't need to go into grave detail here because 1. the oversampling of democrats is consistent with previous polls, and 2. I can just give a brief summary of the results after unskewing the samplings:
CNN Reported: Tie - After unskew: Romney +9.4
CNN Reported: Tie - After unskew: Romney +9.4
Pew Reported: Obama +3 - After unskew: Obama +2.2
PPP OH Reported: Obama +5 - After unskew: Obama +0.3
PPP VA Reported: Obama +4 - After unskew: Romney +1
PPP FL Reported: Obama +1 - After unskew: Romney +2.5
PPP IA Reported: Obama +2 - After unskew: Obama +1.8
PPP NH Reported: Obama +2 - After unskew: Obama +1.1
PPP NC Reported: Tie - After unskew: Romney +3.3
November 2 - An Iowa poll that samples D +6 gives Obama a lead of +4. Unfortunately for Romney, when unskewed, Obama's lead only drops to +3.4
Poll: http://www.gravispolls.com/2012/11/final-iowa-public-opinion-poll2012.html
Results:
Click Image for Expanded View
Summary: When unskewed, this poll does not paint a great picture for Romney. The main reasons are because, according to Gallup, Iowa is a democrat-heavy state, and additionally, Obama is pulling in plenty of GOP support in this poll. The positives to take from the Gravis poll are that Romney is winning independents 43 to 38, and that remaining, non-early voters are favoring Romney, too.
October 31 (Updated at 9:18am - PA) - CBS reports that in three key states, FL, OH, and VA, Obama is leading Romney, but it oversamples democrats by +7, +8, and +8, respectively.
UPDATE (PA Poll): http://www.fandm.edu/fandmpollhttps://edisk.fandm.edu/FLI/keystone/pdf/keyoct12_1.pdf
Results:
Click Image for Expanded View
Summary: Now this one is a little tricky. Notice the asterisk next to the likely voters number. In the poll's crosstabs, all results shown are for likely voters, but the poll's crosstabs are for registered voters. This leads to some, though small, inaccuracy in reporting. The main things to take away, however, are that Romney is winning with independents (48 - 32), and yes, when unskewed, with registered voters (which usually are stronger for democrats).
See the CBS poll (all states combined): http://www.scribd.com/doc/111619086/Quinn-10-31-FL-OH-VA?secret_password=2l8php1ck5l2c2wr8j6x
Results:

Click Image for Expanded View
Summary: As stated, these polls oversampled democrats heavily. While it is difficult to predict how each party will turn out in 2012, there is no reason to believe the voting demographic will turn out as these polls claim they will. Once unskewed, Romney leads in FL and VA by 1.9 and 1.7 points, respectively. In OH, Obama maintains a 1 point lead. The recent trend of Romney capturing independent votes remains, but there is one caveat: in Ohio, for example, Romney is winning among independents 49-43... which is the exact same percentage McCain carried the state by in 2008. This is not good news for Romney as he needs a stronger independent showing to capture this crucial swing state.
October 29 - Four key swing state polls are reported as Obama leads or ties... but are heavily oversampled. Unskewed analysis shows strong positions for Romney.
Ohio Poll (PPP): http://www.publicpolicypolling.com/pdf/2011/PPP_Release_OH_1028.pdf
Ohio Poll (Gravis Marketing): http://www.gravispolls.com/2012/10/gravis-marketing-ohio-poll-results.html
Florida Poll (PPP): http://www.publicpolicypolling.com/pdf/2011/PPP_Release_FL_1028.pdf
Virginia Poll (Gravis Marketing): http://www.gravispolls.com/2012/10/virginia-presidential-and-senate-poll.html
Results:

Click Image for Expanded View
Summary: In both the Ohio PPP and Gravis marketing poll, democrats were oversampled by a +8 count. When unskewed, using Gallup's party affiliation demographic information (which does show a slight democrat oversampling), Romney was up in PPP's poll by +0.9 and by +2.8 in Gravis' poll. In Florida, a 5 point democrat oversampling led to a +1 Obama result, but unskewed results showed Romney up by 1.6 points. In Virginia, democrats were oversampled by an unrealistic 8 points, resulting in a tie overall, but after the data was unskewed, Romney had a 5.6 point lead. In every poll, Romney did significantly better among independents. The smallest lead he had was by +4 in the OH PPP poll, and the largest independent lead he had was by 17 in the VA poll.
October 24 - Survey USA poll shows Mitt Romney's unskewed lead drops
Poll: http://www.surveyusa.com/client/PollReport.aspx?g=86d85b21-8b9a-4661-99ab-3b88b2335cf2
Results:
Click Image for Expanded View
Summary: One week ago, Survey USA released an Ohio poll that showed the president with a 3-point lead. When unskewing that poll, Romney had a 1.1 poll lead. In this week's poll, Obama increased his support among republicans and independents (from 33% to 39%) while Mitt Romney lost a little republican support but gained independent support (from 41% to 47%). While this 8-point lead among independents remains strong for Romney, his slight erosion with republicans has caused his unskewed lead to drop to 0.2 points.
October 22 - Two key Ohio polls were released today, both oversampling democrats heavily, and both showing results that are more favorable to Mitt Romney.
CBS/Quinnipiac Poll: http://www.cbsnews.com/8301-250_162-57536922/poll-obamas-lead-in-ohio-narrows/?pageNum=3&tag=page
PPP: http://www.publicpolicypolling.com/pdf/2011/PPP_Release_OH_1020.pdf
Results:

Click Image for Expanded View
Summary: The CBS poll oversampled democrats 35% - 26% and reported a result of Obama leading 50% to 45%. The main question remains: why would they oversample democrats so heavily. There is no indication that the party affiliation of Ohio has 34.5% more democrats than republicans. Once unskewed using Gallup's demographic data, Obama was winning by only 0.4 points. The PPP poll, which oversampled democrats 42% - 34%, once unskewed, shows Romney with a 4.3 point lead. Perhaps the most glaring piece if information in both polls: Mitt Romney leads among independents 49% to 42%.
October 19 - A Hartford Courant/UConn puts Obama ahead by three; oversamples democrats 47 - 39.
Poll: http://www.realclearpolitics.com/docs/2012/Courant_UConn_1019.pdf
Results:
Click Image for Expanded View
Summary: There is no indication that the country is laid out with a 47 - 39 D to R spread. When unskewing the poll using Gallup's data, Obama's lead is cut to 0.5 points. Using Rasmussen's data, Romney leads by 5.6. Notice also, as the trend has been lately, Romney is getting 9% of democrats while Obama is getting only 6% of republicans.
October 18 - A +7 democrat poll in Ohio when unskewed shows Romney up slightly, and an IBD daily poll shows that Romney's lead in this daily tracker has dropped.
OH Poll: http://www.surveyusa.com/client/PollReport.aspx?g=9fe706c7-86ef-4698-b0d3-15ec2d79d203
Results:
Click Image for Expanded View
Summary: This poll oversamples democrats 39 - 32 though there is no empirical evidence to support this. There is no data showing that democrats outnumber republicans in Ohio by 22%. Once unskewed using Gallup's party affiliation data, Romney has a 1.1 point lead.
Results:
Click Image for Expanded View
Summary: This poll has favored Romney recently even with a large democrat oversampling. The IBD poll has consistently oversampled democrats 37 - 30, though there is no evidence to support that this is how the country is laid out (Gallup says it's 27.7% R - 30.% D while Rasmussen says it's 37.6% R - 33.3%D). Regardless, when using either demographic data, Romney comes out with a lead in both polls. Even in the democrat-heavy Gallup data, Romney leads by 0.3 points. This is because he is getting more republican votes than Obama is getting democrat ones, and he is winning independents by 5 points, a trend that seems to exist nationwide.
October 16 - A poll in PA shows Mitt Romney is close once unskewed. An Iowa poll shows the situation isn't as bright for Romney, and in VA, things are looking good for Romney/Ryan.
PA Poll: http://www.mcall.com/news/nationworld/blog_pennsylvania_ave/mc-read-muhlenbergtmc-pa-presidential-election-survey-10152012,0,1372801.htmlstory
IA Poll: http://americanresearchgroup.com/pres2012/IA12.html
VA Poll: http://americanresearchgroup.com/pres2012/VA12.html
Results:

Click Image for Expanded View
Summary: Once unskewed, after a heavy 49 - 40 democratic oversampling in PA, Mitt Romney has closed the gap to a 1.9 point lead for Obama, 46.8% to 44.9%. In Iowa, however, though Mitt Romney is winning among independents by 4 points, Obama's strong democrat demographic in the state (using Gallup's data), puts him in an expanded 4 point lead. In Virginia, the poll reported a 48 - 47 Romney lead, but that was with a 40 - 35 democrat oversampling. Once unskewed, Romney has a 4.9 point lead.
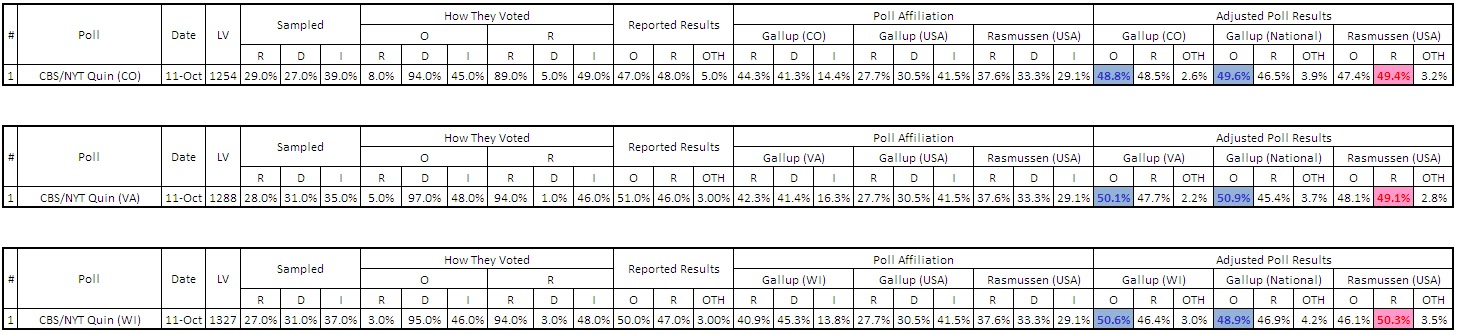
October 11 - Lots of polls released today, but only the CBS/Quinnipiac polls release the "who voted for whom" crosstabs. Because of this, these are the only polls that can be analyzed, and they don't paint the greatest picture for Romney.
Poll's Press Release: http://s3.documentcloud.org/documents/460539/qunnipiac-new-york-times-cbs-polling-results.pdf
Voter Breakdown: http://elections.nytimes.com/2012/swing-state-polls?ref=newyorktimespollwatch
Results:
Click Image for Expanded View
Summary: Neither of these polls are good for Romney. In Colorado, republicans were oversampled and gave Romney a one point lead. But after oversampling, even with the republican-tilted Gallup demographic data, Obama's larger pull of in party support and republicans overrode the state's affiliation makeup and Romney's lead with independents. In Virginia, the poll was reported with a 5 point Obama lead. Looking deeply into the poll, we see Obama gaining a stronger support from democrats, cross-party republicans, and independents. After Gallup's affiliation data is injected, Obama's lead shrinks solely because of the republican lean in the state. No one knows if this will carry through to the election. In Wisconsin, more respondents said they were republican than in the state's Gallup data (in a relative sense). This gave Obama only a 3 point lead in the poll's results, but after unskewing the data, that lead grew 4.2 points. Romney is, however, leading among independents in the state.
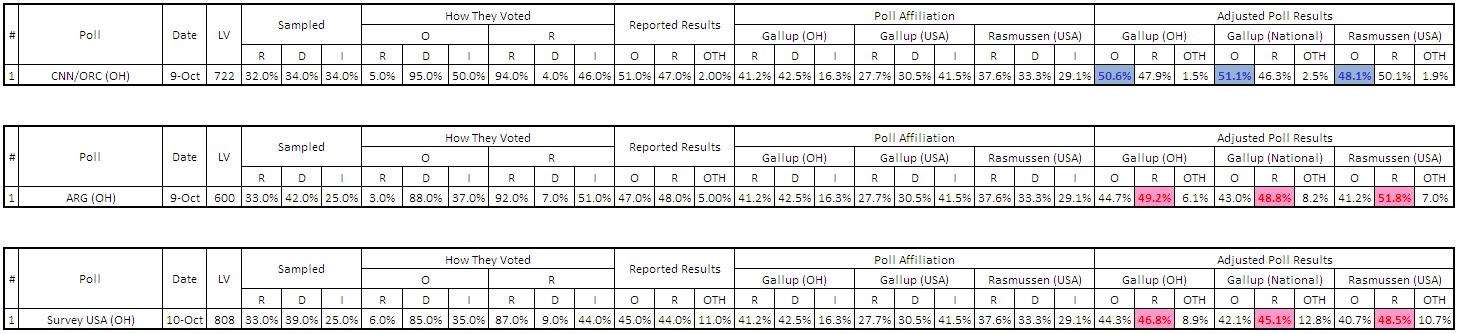
October 10 - Lots of polls to go through: Ohio shows strong independent backing of Romney in 2 of 3 polls, Romney up big nationally, in Colorado, and some interesting data in Nevada
National Poll:
IDB/TIPP: http://news.investors.com/special-report/508415-ibdtipp-poll.aspx
Results:
Click Image for Expanded View
Summary: Even though this national poll oversampled democrats 39% to 31%, the reported results showed Mitt Romney with a 2-point lead. After unskewing the poll, using Gallup's party affiliation data, Romney lead by 7.1 points (49.2% - 42.1%). When using Rasmussen's data, Romney's lead jumped to 11.4 points (52.1% - 40.7%). The strong showing by Romney is because of the massive backing of independent voters, 52% to 34%.
Ohio Polls:
CNN/ORC: http://i2.cdn.turner.com/cnn/2012/images/10/09/topgenstate4.pdf
ARG: http://americanresearchgroup.com/pres2012/OH12.html
Survey USA: http://www.surveyusa.com/client/PollReport.aspx?g=564b76d9-2e24-4689-a7a6-8b760fc858a6
Results:
Click Image for Expanded View
Summary: Is CNN the outlier? Both the ARG and the Survey USA poll show independents favoring Romney 51% to 37% and 44% to 35%, respectively. CNN claims independents favor Obama 50% to 46%. In the CNN poll, democrats were slightly oversampled, and CNN reported the results as 51% - Obama, 47% - Romney. This isn't far off from the unskewed results which show the race as 50.6% - Obama, 47.9% - Romney.
In the ARG poll, even with democrats oversampled 42% to 33%, Romney was still winning 48% - 47%. After the poll was unskewed, Romney was leading by 4.5 points, 49.2% to 44.7%.
The Survey USA poll shows a very similar trend. The poll oversampled democrats 39% to 33%, but the reported results had Obama up 45% to 44%. After the poll was unskewed, Romney was winning 46.8% to 44.3%.
Colorado:
Results:

Click Image for Expanded View
Summary: SURPRISE! This is the first poll that I have seen that over-sampled republicans (34% - 33%). It doesn't line up with the Gallup affiliation data that shows republicans outnumber democrats in the state 44.3% to 41.3%. Regardless,the poll's reported results showed Romney winning by 4. After applying Gallup's affilitation data, Romney is winning by 7.5 points, 52.1% to 44.6%. This is in spite of the fact that Obama, according to this poll, attracted more independents (48% to 47%). Romney's strenght comes from his backing by republicans (94% compared to only 87% that back democrats), and by cross party backing (Romney pulled 9% of democrats while Obama only pulled 4% of republicans).
Nevada:
LVRJ/Survey USA: http://www.lvrj.com/hottopics/politics/polls/oct_2012_polls_president_101012.html
Results:

Nevada:
LVRJ/Survey USA: http://www.lvrj.com/hottopics/politics/polls/oct_2012_polls_president_101012.html
Results:
Click Image for Expanded View
The results here are interesting. The poll itself oversamples democrats 40% to 33%, but the published results show only a one point Obama lead. Using Gallup's affiliation breakdown for the state, Romney jumps into a lead of 1.8 points. This is because of a strong independent voter pull (47% to 39%), and because Romney attracts 11% of democrats while Obama attracts 9% of republicans.
There is one caveat here. A Huffington Post article claims the current voter registration in Nevada is 41.6% democrat, 35.6% GOP. Using these numbers, highlighted in the chart above, give Obama a 1.3 point lead. Will this carry through to the election? Who knows?
October 9 - PA poll oversamples democrats 47% to 40% - claims Obama is up by 3. Unskewed results show Obama is up by only 0.7 pointsThere is one caveat here. A Huffington Post article claims the current voter registration in Nevada is 41.6% democrat, 35.6% GOP. Using these numbers, highlighted in the chart above, give Obama a 1.3 point lead. Will this carry through to the election? Who knows?
Siena Poll: http://www.siena.edu/uploadedfiles/home/parents_and_community/community_page/sri/sny_poll/PA%20Likely%20Voters%20October%202012%20Crosstabs.pdf
Results:
Click Image for Expanded View
October 8 - Two key polls released today: One in Virginia that shows that after being unskewed for a 38%-32% D - R oversamling, Romney is in the lead using Gallup's party affiliation data, and a Politico/GWU/Battleground poll that shows Romney leading using both Gallup's and Rasmussen's national party affiliation trends
VA PPP Poll: http://www.publicpolicypolling.com/pdf/2011/PPP_Release_VA_1007.pdf
Results:
Summary: PPP, a democratic-leaning polling company, oversampled democrats significantly in this poll when there is no justification for it. Gallup's latest data shows republicans slightly outnumber democrats in the state. Once unskewed, the data shows Romney is leading in this key battleground state. Also, in a sheer showing of silliness, if you go the last pages of the poll, you will notice the respondents were sampled for their opinions on the likability of Big Bird. Come on... seriously?
Politico/GWU/Battleground Poll: http://www.politico.com/news/stories/1012/82122.html
Results:

Politico/GWU/Battleground Poll: http://www.politico.com/news/stories/1012/82122.html
Results:
Click Image for Expanded View
Summary: Once unskewed, Mitt Romney would be besting Obama handily. Most importantly is the margin by which Romney is beating Obama among independents: 51% - 35%.
October 3 - Another grossly democrat oversampled poll in North Carolina, and another unskewed result showing Mitt Romney with a huge lead in the state
Poll: http://www.wral.com/asset/news/state/nccapitol/2012/10/02/11616539/WRAL_News_poll_Oct._2_2012_.pdf
Results:
Click Image for Expanded View
Summary: Nothing new here: democrats are oversampled 45%-35%, and even with that, the poll reports a 2-point lead for Obama. After unskewing the data, Mitt Romney is up significantly.
October 2 - National polls don't paint a rosy picture for Obama
Polls:
CNN/ORC: http://i2.cdn.turner.com/cnn/2012/images/10/01/rel11a.pdf
ABC News/Washington Post: http://i2.cdn.turner.com/cnn/2012/images/10/01/rel11a.pdf
Results:

Click Image for Expanded View
Summary: Let's start with the poll and its oversampling:
CNN: Oversampled democrats 37% - 29%. Reported results: Obama + 3
ABC News: Oversampled democrats 33% - 28%. Reported results: Obama +2
Un-skewed Results:
CNN using Gallup: Romney + 2.3 / CNN using Rasmussen: Romney + 8.0
ABC using Gallup: Obama + 0.7 / ABC using Rasmussen: Romney + 4.7
The first thing that's noticed is, as expected, the rampant oversampling. These are nationwide polls. By CNN oversampling democrats like it did, it's claiming there are basically 28% more democrats in the country than republicans? There is no indication that this is the case. Secondly, with an oversampling of 37% to 29%, you would expect Obama to lead by 8 percentage points, right? Wrong... and this leads us to the second thing that's noticed: independent voters. In BOTH polls, Mitt Romney captures the independent vote by 4 points and by 8 points. This is telling, and it's not often told in the mainstream media. The word should get out.
Poll:
Quinnipiac National Poll: http://www.quinnipiac.edu/institutes-and-centers/polling-institute/national/release-detail?ReleaseID=1801
Results:
Click Image for Expanded View
Summary: After unskewing the +6 democrat over sampling, Obama's lead falls from a reported +4 to +3.1 using Gallup party affiliation information. While this isn't a significant drop, Obama retains his lead because of a stronger republican-for-Obama vote. This, however, is highly elastic and variable. Looking through the previous polls analyzed in this post, we see little consistency in the republican-for-Obama segment. We do see some consistency in the independent vote, however, as once again, independents favor Mitt Romney. This is key going forward.
October 1 - Two Ohio polls largely over-sample democrats. Two North Carolina polls that show Mitt Romney should have a large lead, and mixed results in Florida. Virginia un-skewed poll shows a Romney lead across the board.
Ohio Polls:
Columbus Dispatch: http://www.dispatch.com/content/stories/local/2012/09/30/1-dispatch-poll-shows-obama-in-lead.html
PPP: http://www.publicpolicypolling.com/pdf/2011/PPP_Release_OH_930.pdf
Results:

Click Image for Expanded View
Summary: The Columbus Dispatch reported that Obama had a lead of 9 percentage points (51% - Obama, 42% - Romney), but this is after an oversampling of democrats to the tune of 43.3% to 34.5%. It's no surprise that Obama would have a 9-percentage point lead when democrats have been oversampled by about 9 percentage points. When adjusted using Gallup's political affiliation demographic numbers, Obama's lead shrinks to 3.5 percentage points.
A similar case exists for the PPP Ohio poll. This poll oversampled democrats 41% to 36% and claimed that Obama had a lead of 4 percentage points. When unskewing these numbers, the lead actually shrinks to 1.3 percentage points.
North Carolina Polls:
PPP: http://www.publicpolicypolling.com/pdf/2011/PPP_Release_NC_9301.pdf
ARG: http://americanresearchgroup.com/pres2012/NC12.html
Results:

Click Image for Expanded View
Summary: This is, perhaps, one of the most egregious examples of unrealistic democrat oversampling. The PPP poll oversampled democrats 48% to 34%. The ARG poll oversampled them 43% to 33%. There is no data that supports this 41% margin in democrat voters. Gallup's party affiliation data shows the breakdown is 42.1% R to 43.0% D. When using this more realistic party affiliation spread for the PPP poll, Romney jumps out to a 9.2 percentage point lead. For the ARG poll, his lead goes from + 4 to + 9.7. In addition, we notice that he leads in grabbing independent votes 54%-36% in the PPP poll, and 55% - 40% in the ARG one. Also, Romney captures a larger percentage of democrat votes than republican votes that Obama grabs.
Poll: http://www.realclearpolitics.com/docs/2012/Gravis_FL_1001.pdf
Results:
Click Image for Expanded View
Summary: This poll shows some mixed results. With a 3 percentage point oversampling of democrats (36.7% to 33.7%), Obama only has a 0.6 percentage point lead (49.0% to 48.4%). Using Gallup's party affiliation breakdown, (42.2% D to 40.4% R), his lead jumps to 49.1% to 48.4%. In theory, Obama is still winning the state based on the fact that more democrats exist than do republicans. One key factor comes to mind when thinking about this specific poll: What about voter enthusiasm? Recent reports show republicans are much more enthusiastic about voting than democrats are. Additionally, this poll shows independents favor Romney by a strong 51.6% to 45.3%. Who knows how this will turn out. If independents have grown in the state, this could be a red-state victory for Romney.
Virginia:
Poll: http://americanresearchgroup.com/pres2012/VA12.html
Results:
Click Image for Expanded View
Summary: This ARG poll claims there is a 2-point Obama lead. Given that the poll over-sampled democrats by three points it doesn't paint a good picture for the president. Using Gallup's party affiliation information, Romney should have a 1.5 percentage point lead in the state.
September 26 - CBS/NYT/Quinnipiac poll grossly over-samples democrats, does not publish "how they voted" breakdown for Pennsylvania.
Poll: http://www.scribd.com/fullscreen/106996283?access_key=key-2kvio2cwa69e8ecedy9p
Results:

Click Image for Expanded View
Summary: The over-sampling of democrats in Florida gives Obama a 9-point lead. In Ohio, it gives Obama a 10-point lead. Using Gallup's statewide party affiliation data, if the sampling better reflected these states, Obama's lead would be cut to 3.1 points and 4.4 points in Florida and Ohio, respectively. As expected, nearly every major news publication ran the headline "Obama opens up wide lead in FL, OH, and PA" this morning.
September 24 - Using un-skewed results, is Minnesota really out of reach for Romney?
Poll: http://www.startribune.com/politics/statelocal/170917611.html?refer=y .
Voter breakdown: http://www.startribune.com/politics/170563536.html
Results:
Click Image for Expanded View
Summary: The over-sampling of democrats in this poll gives Obama an 8-point lead. When Gallup's Minnesota party affiliation data is used, Obama's lead drops to 3.7%.
Hi LME
ReplyDeleteThanks for the better breakdown of the polls.
Me? I've decided NOT to listen to the MSM's cries of 'This race is over! Obama won!' and all their fact twisting, refusal to report and other assorted misbehaviors.
I'll just keep on keepin' on, fighting the good fight and praying for the guidance of Divine Providence b/c as 'they' say...
The show's not over 'til the fat lady sings : )
p.s. For anyone who's interested: 'The Project' airs on TheBlaze Dishnet ch 212 and TheBlaze/tv at 8pm eastern tonight and tomorrow night.
I like your choice to factor in the individual state splits :) that resolves most of my initial concern with the levels of accuracy in these projections.
ReplyDeleteMy only other comment would be:
I feel that purposefully oversampling could just as easily be detrimental towards a Democrat victory. You mention that making it appear the Dems will win, might discourage Republicans from showing up to vote because of a sort of 'why bother?' mentality. But doesn't it go both ways? If Democrats feel that this will be an easy win, I could just as easily see people justifying the 'why bother?' idea as well (meh, not worth the effort if it's going to be a landslide).
The Reagan election could be a possible example of this. It was by far the biggest landslide victory in recent history, yet, it’s one of the lower % voter turnouts over the past 50 years:
http://www.infoplease.com/ipa/A0781453.html
Although, difficult to find the info for Dem vs Repub voter turnout, that would be interesting to see.
@RKen I saw/heard something that might address the oversampling of Dems and explain how it MIGHT be unintentional.
DeleteIf the pollsters are using prefixes for cell phones with more frequency than those of land lines - the percentage would most likely lean MORE toward younger voters... who, according to most pollsters are more likely to be Dems/Obama supporters.
It 'sort of' makes sense - but I don't really buy it : )
That makes sense, and is certainly a possibility Dara. I'd imagine that there are definitely some meaningful statistical differences in reaching an average Dem/Conservative depending on cell vs landline, time of day, day of the week, and how often one will respond to the poll, etc. Though, difficult to quantify and figure out... and likely wouldn't explain margins as big as typically seen.
DeleteUN PRESIDENT TIM KALEMKARIAN, US PRESIDENT TIM KALEMKARIAN, US SENATE TIM KALEMKARIAN, US HOUSE TIM KALEMKARIAN: BEST MAJOR CANDIDATE.
ReplyDeleteIn reading the poll splits from page 5 of the CNN Poll, they combine 'Democrat Leaning Independents' as Democrats and 'Republican Leaning Independents' as Republicans. If you accept that as a valid methodology, the numbers are even. (413 Rep, 412 Dems) The real question would seem to be whether that is a valid methodology.
ReplyDeleteThank you for writing.
DeleteThe number you are quoting is registered voters. The number that matters is likely voters. When CNN reports Obama has a +3 they are reporting this is among likely voters.
Page 15, the explanation of methodology before you get into the cross tabs, which uses likely voters, explains the following:
Among thoselikely voters, 37% described themselves as Democrats, 34% described themselves as Independents, and 29% described themselves as Republicans.
As becoming apparent with the recent trends in polls, I think that the 'oversampling' issues that were oft-viewed as purposefully skewed or inaccurate representations were simply a result of low voter enthusiasm on the GOP side of the polls.
ReplyDeleteIt's no secret that, at least up until very recently, Mitt failed to rally up the Republican Party throughout his campaign. He was never viewed as a very strong candidate in his ability to rally all stretches of the party behind him; particularly through the primaries. And this is agreed upon pretty well between both sides, liberal and conservative. I’ve long lost count over how many times I’ve heard the facts reiterated in how, at least from a historical point, Mitt should have an incredibly easy race while running against the incumbent with such a sluggish economy.
Despite how displeased the GOP may be with Obama though, that lack of enthusiasm can easily account for such a discrepancy in polling. Keep mind that most of these polls only survey 'likely voters', which isn't the same as simply surveying opinions of registered Dem vs registered Republican. As such, the difference in the % of each party represented in a poll not only comes down to the difference in the number registered in the surveyed populace, but also the difference in enthusiasm between the parties.
There could be twice as many registered Democrats as Republicans in a state, but if Democrats are half as likely to vote (due to enthusiasm for Obama/moral/etc), then of course if you poll that state for likely voters… you’ll find that the poll should have a 50/50 representation of Dems vs Repubs. Which yeah, may seem misleading if the Dems out-populate the GOP at 2 to 1, but is still factually accurate.
And that I think is what we saw in these ‘skewed polls’; simply a lack of enthusiasm on the GOP side. I can’t see it being explained in any other way. It’s not like all these different polling sites ‘magically’ started working ‘correctly’ in unison.
Why do you keep trying to spin this away? Are you so that ashamed of reality that you will spin it to no end? The polls are still skewed, even after this apparent uptick in GOP enthusiasm:
ReplyDeleteTaken yesterday - IDB polls: http://news.investors.com/special-report/508415-ibdtipp-poll.aspx 37% Dem 30% GOP Doesn't match national demographic
Washington Post: http://www.washingtonpost.com/wp-srv/politics/polls/postabcpoll_20121013.html 35% Dem 26% GOP Doesn't match national demographic
Virginia poll: http://americanresearchgroup.com/pres2012/VA12.html 40% Dem 35% GOP Doesn't match state demographic
PA poll: http://www.publicpolicypolling.com/pdf/2011/PPP_Release_PA_1014.pdf
48% Dem 37% GOP Doesn't match state demographic
So which is it? GOP enthusiasm is up? Are you sure about that? Please stick to reality. Polls are still oversampling.
Ashamed of reality? My argument, which you failed to address, is exactly base d in that.
DeleteI'd like to hear your explanation for when nearly all of the polls universally and at the same exact time, switched to grossly oversampling Republican voters in the days immediately after the first debate.
I don't see any other explanation for that making realistic sense other than the one I presented.
But I also, again, invite you to provide some other explanation I may have missed that isn't some ridiculous 'all of the different polls secretly collaborated to unskew the results for a couple of days before returning, in a gradual and perfectly matched tandem, to skewing them once more.' Which apparently is your argument?
I'm a little surprised, Rken. You typically don't make blanket statements, and I respect that in you.
DeleteI did address your argument. Your argument was the low GOP polling numbers were due to a lack of enthusiasm pre-debate. That is false, and I showed you how it is false. I gave you some of the examples of POST debate polls to show you're incorrect. Democrats are still being over sampled, and nothing has changed. So indeed, I addressed you argument and I provided proof of how it's incorrect.
"I'd like to hear your explanation for when nearly all of the polls universally and at the same exact time, switched to grossly oversampling Republican voters in the days immediately after the first debate."
What are you talking about???? I just gave you 4 of the polls from YESTERDAY. Since oct 3rd, there have been tons of polls, and no, there is no universal move. They are STILL oversampling democrats. This is where I'm surprised. You made a statement and you didn't back it. It's not like you. Saying something exists, though it doesn't, doesn't all of a sudden make it exist. You didn't show your side to be the case. I showed mine. Again, please stick to reality. It's held up by evidence.
You're missing it again; I'll make it as clear as I can. I said:
Delete"I'd like to hear your explanation for when nearly all of the polls universally and at the same exact time, switched to grossly oversampling Republican voters in the **********days immediately after the first debate**********."
You said:
"I just gave you 4 of the polls from **********YESTERDAY**********."
Yesterday != days immediately after the debate. Get it?
I'm referring to polls from the few days after Oct 3rd. At most, let's say up to 1 week after the day of the debate. You know, "the days immediately after the first debate." Like I said.
You're attempting to refute my point about the polls from Oct 3rd to ~Oct 10th, with a poll from Oct 15th. That has nothing to do at all with the time period I'm referring to in question.
This time period:
Gallup poll accused of 'oversampling Repubs', with a 49-47% lead in favor of Romney
http://www.gallup.com/poll/157955/romney-obama-among-likely-voters.aspx
The Pew poll also called out on 'oversampling Repubs' after first debate, with a 49-45% lead in favor of Romney:
http://www.alternet.org/election-2012/10-things-you-should-know-about-post-debate-polls?page=0%2C1
http://www.people-press.org/2012/10/08/romneys-strong-debate-performance-erases-obamas-lead/
Or even 8 point oversampling towards Republicans from a CNN VP poll (out of the aforementioned time period, but figure I'll throw it in here too).
http://www.cnn.com/POLITICS/pollingcenter/polls/3262
And others I can post later if you want once I have more time.
So, once again, what explains this mystical switch in GOP oversampling immediately after the debate (among 'liberal polls'), if [according to you] it has absolutely nothing at all to do with voter enthusiasm? What reality (as you like to put it) is being missed here?
Go here: http://www.realclearpolitics.com/epolls/latest_polls/ a collection of polls. Look at any poll from say Oct 5th - 10th. NOTHING CHANGED. STILL THE SAME DEMOCRAT OVERSAMPLING. You're completely wrong in this. You're saying things that just don't exist. You have ONE poll (pew) as your evidence. In that list gave you, there are many, many more that back my claim. I can't believe you're disputing this. When you check through each individual poll like I did, will you then admit it?
DeleteTypo, fixing for clarity:
Delete" it doesn't change the fact that polls that were previously 'oversampling Democrats' switched to 'oversampling Republicans' in the days immediately after the **first debate**."
UN PRESIDENT HUGH HEWITT, US PRESIDENT HUGH HEWITT, US SENATE HUGH HEWITT, US HOUSE HUGH HEWITT, GOVERNOR HUGH HEWITT, LT GOVERNOR HUGH HEWITT: BEST MAJOR CANDIDATE.
ReplyDelete